
What is this?
It should come as no surprise that BIPOC students of all stripes are significantly underrepresented in higher education. The root causes of this have been well-studied by other projects, institutions, and organizations, far beyond what we ourselves would be capable of. We are interested, rather, in how the lack of representation affects liberal arts college environments and the students themselves, and where various points in these colleges’ diversification efforts fit within broader national and global moments. The five of us are from four different colleges–Swarthmore, Vassar, Carleton, and Hamilton–and our research and analysis relies primarily on sources from those institutions’ digital archives and other portions of the school websites, alongside data gathered from the National Center for Science and Engineering Statistics (NCSES).
What did we do?
Initially, we focused on the underrepresentation of POC students in academic departments, STEM subjects in particular. However, during our researching process, we realized that, due to how student information is stored and made available by our respective institutions, this question is not easily addressable with the current online archives. Thus we had to change our method, and began researching what we could find related to POC students in general to see how their experience shifted over time. Though this was a reluctant decision, we were still able to draw meaningful observations from the data we collected. For ease of navigation, we’ve divided our work into distinct sections. The first three rely on data visualizations to illustrate how enrollment trends have changed over time, and to highlight some of the events occurring at our respective institutions leading to, contextualizing, or emerging from those trends. We have also included a collection of links to on-campus organizations at some of our colleges, to raise awareness of what social, administrative, and educational resources are available.
Why did we do it?
Stories matter. National and institutional statistics about student diversity, enrollment, discrimination, and graduation are important, and a lot of useful things can be done with them. But on its own, that kind of data is just numbers, and its difficult to connect to numbers. But people like narratives, and in many ways they can have a greater impact on individual perception than any amount of statistical analysis. We wanted to find a way to turn data dominated by numbers into something that tells a story, and places those numbers in their historical context. We also set out with the explicit goal of creating something useful–a nebulous goal to be sure, but one we believe we have accomplished. The different visualizations, analyses, and resources below are intended to contextualize lived experience. Though our scope is limited due to only having a few weeks to assemble this project, they point towards further questions in need of answering, college-specific support networks, and educational resources for anyone wishing to learn more about BIPOC representation and experiences at our respective institutions.
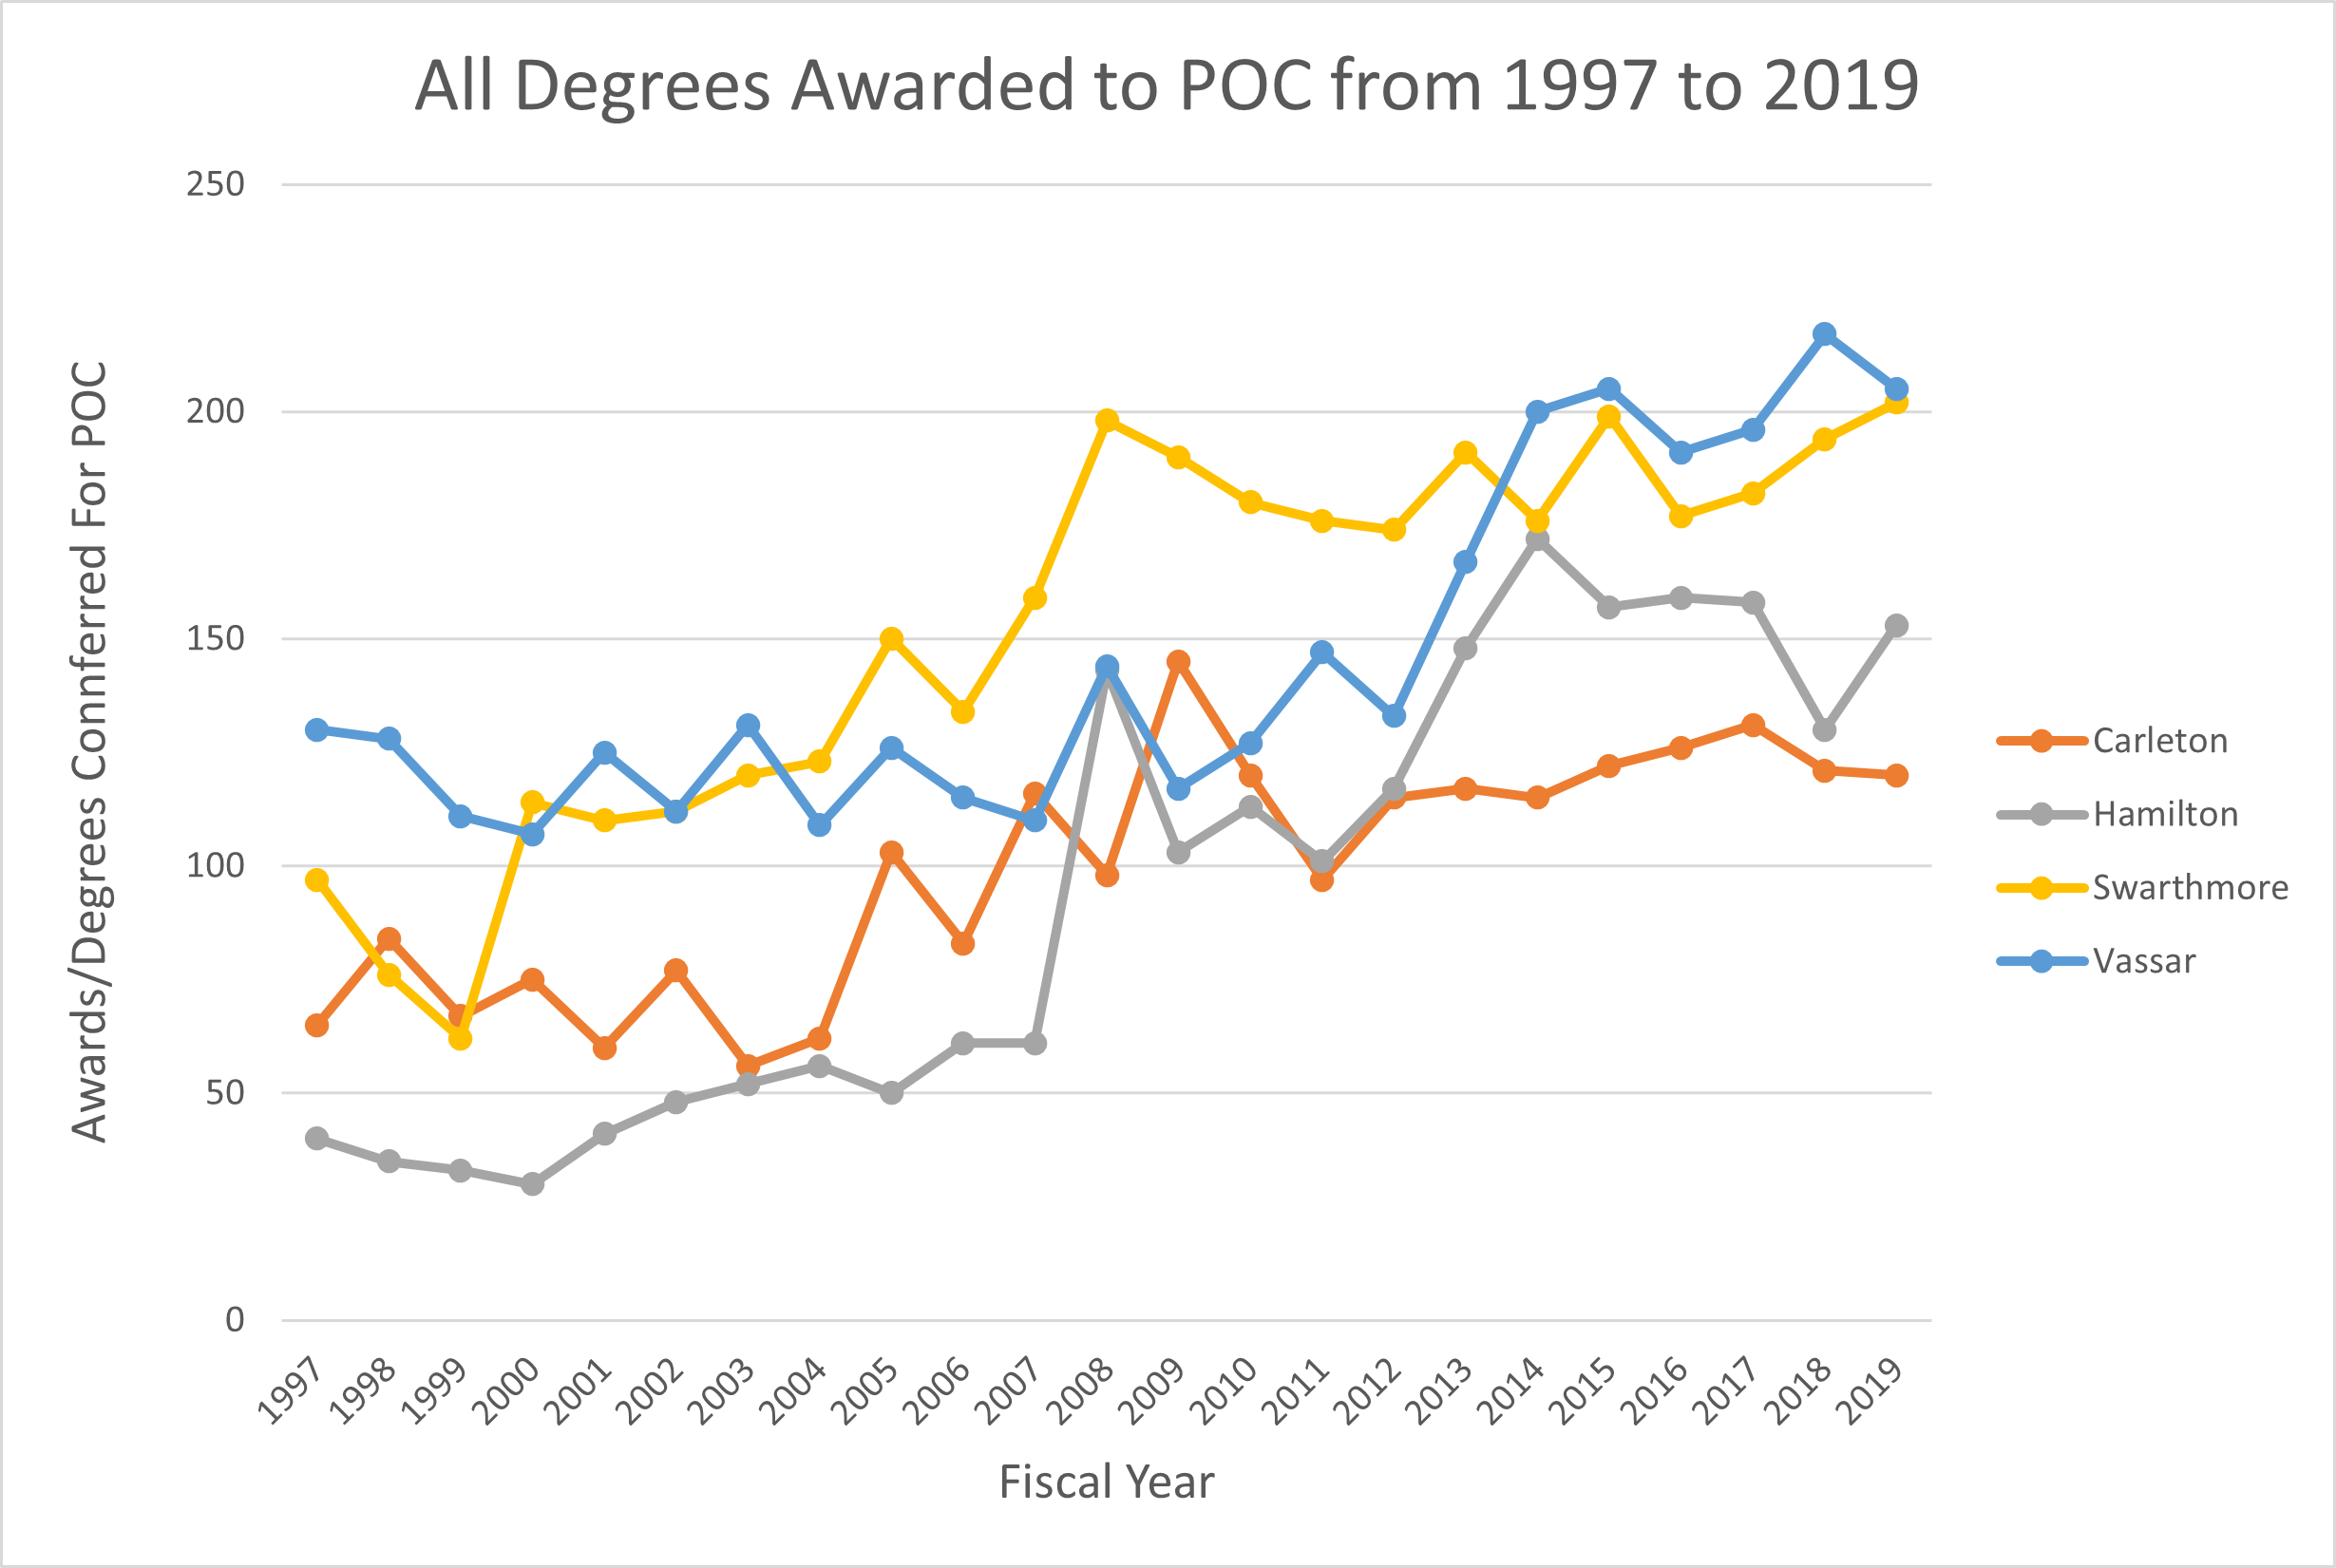
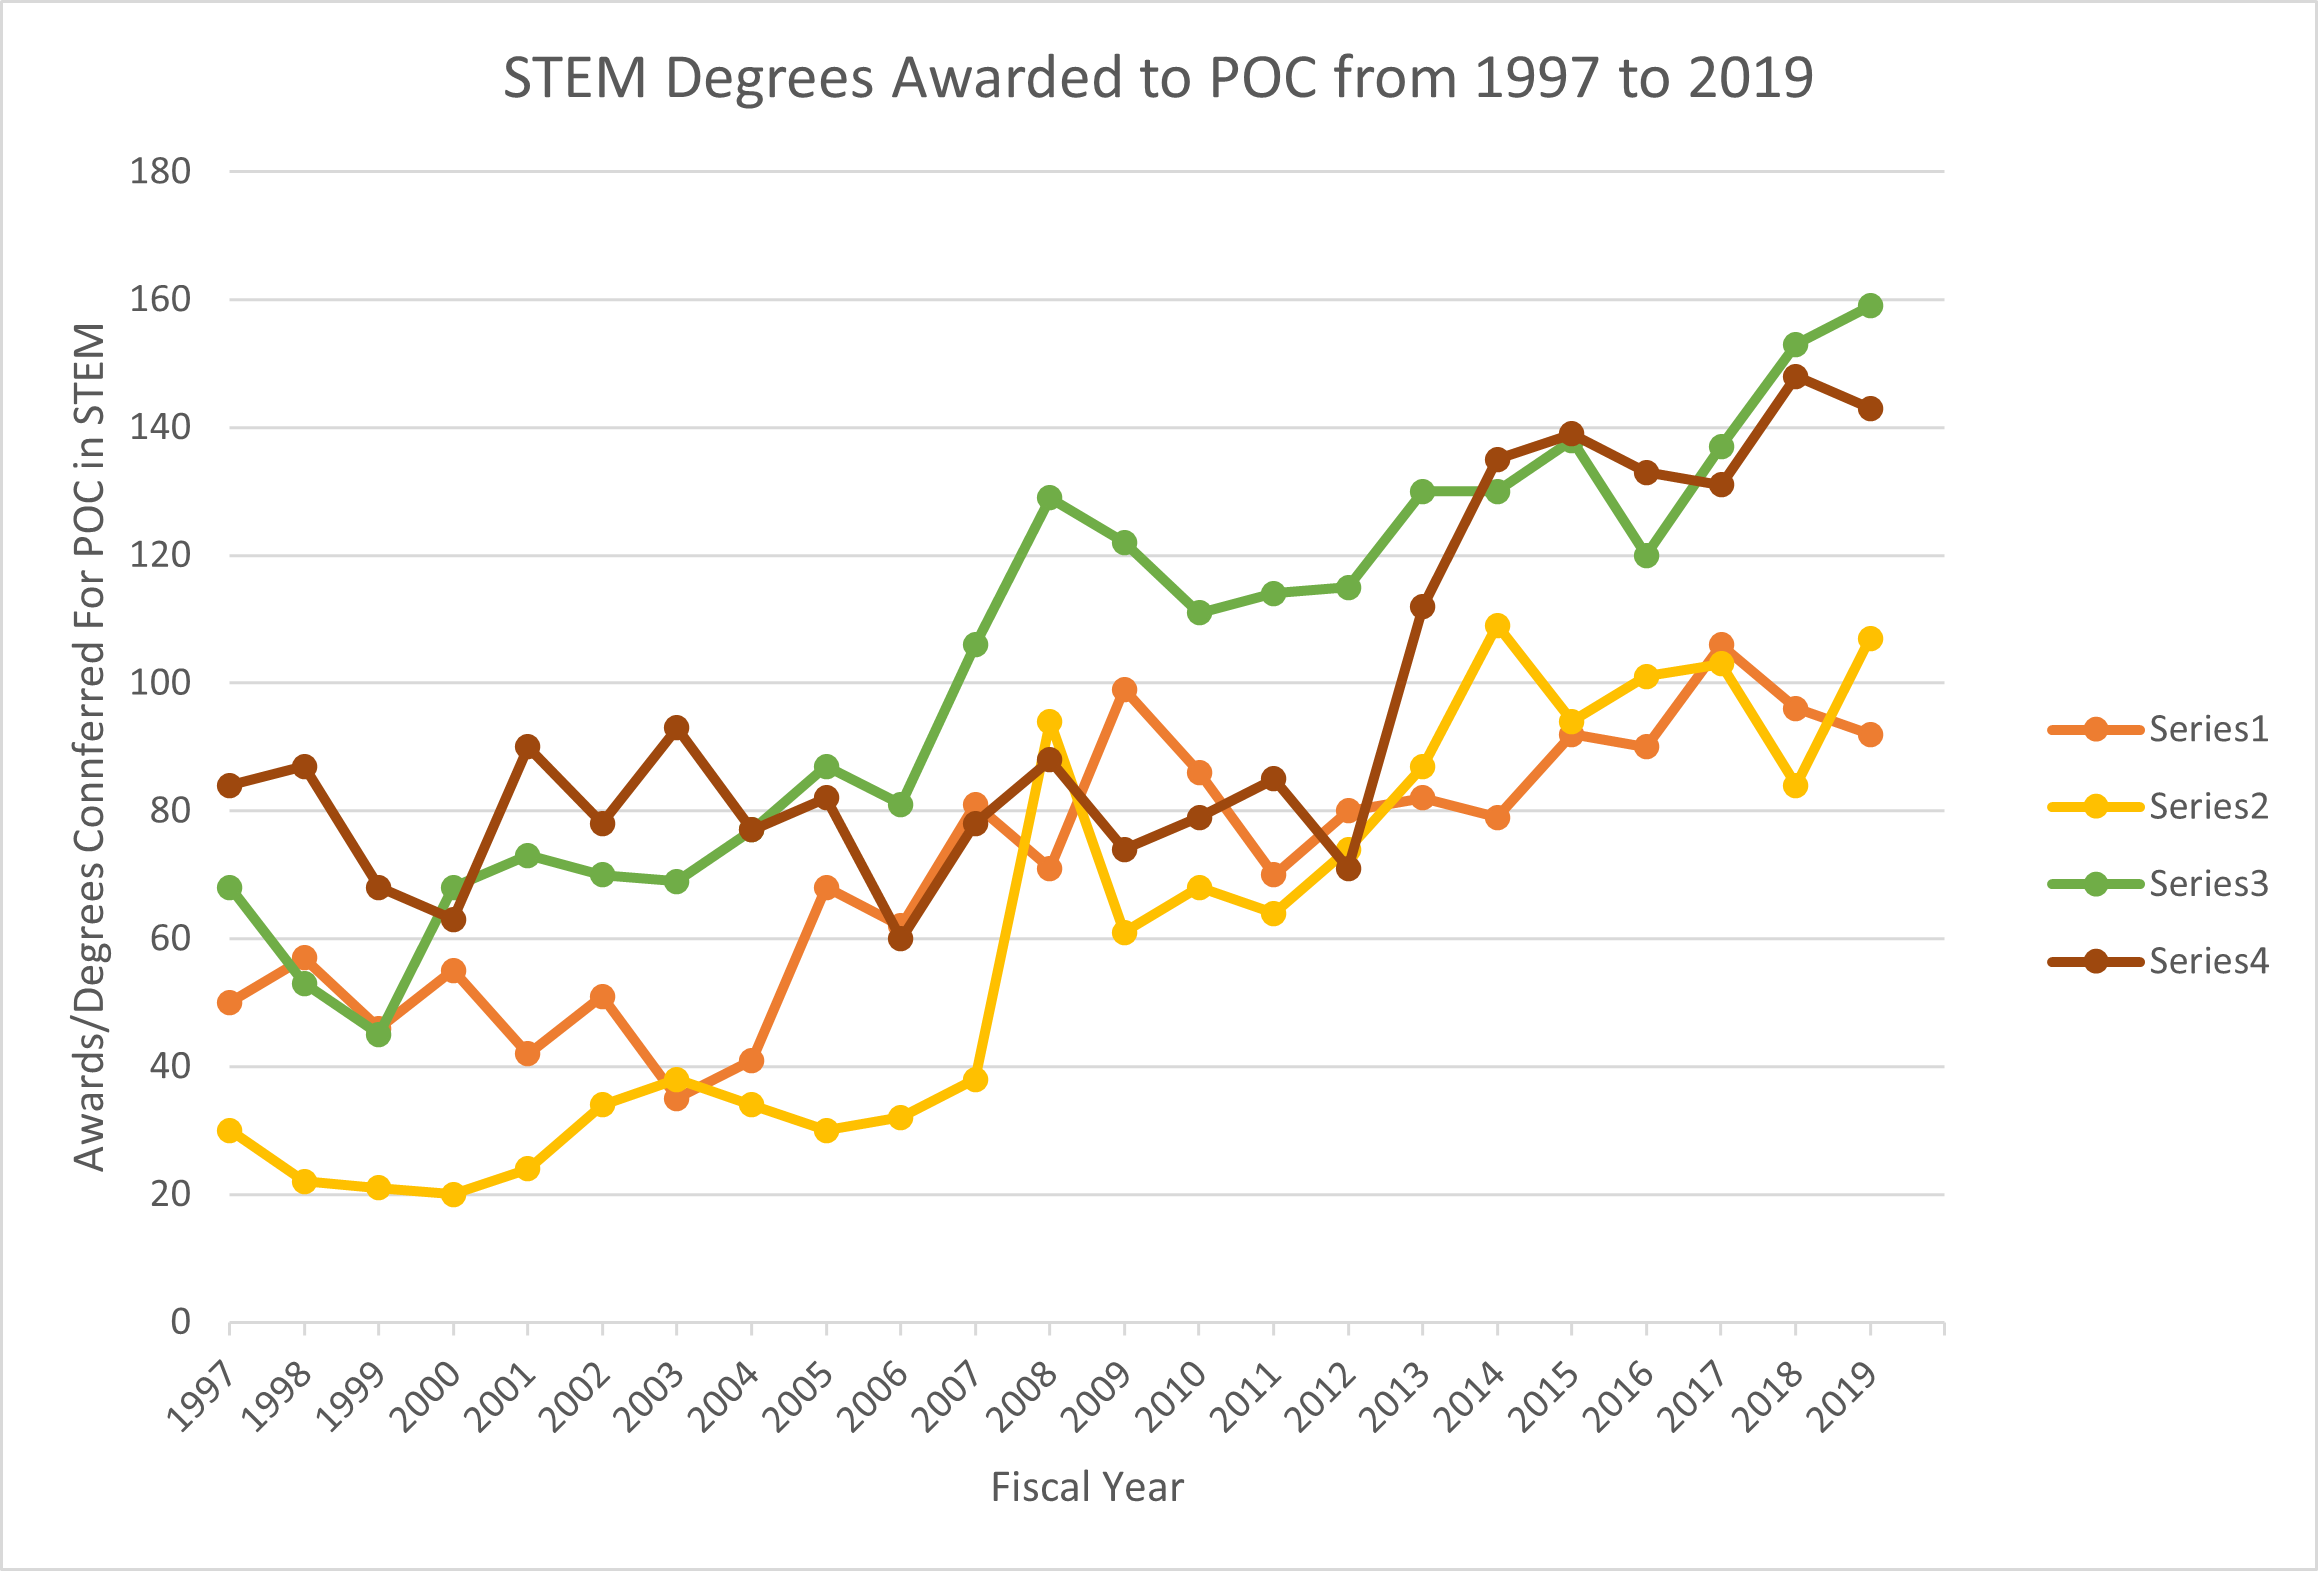
The two graphs show the relationship between POC and degrees attained in college. While the first graph reflects the general trend observed over twenty-two years, the second graph more specifically shows STEM degrees conferred for POC. It is important to note that the “degrees awarded” shows the number of degrees awarded and does not reflect the general percentage or proportion of POC in relation to the larger student population. For instance, although Swarthmore has the highest number of graduating POC attaining STEM degrees in 2019, what is not shown in this graph is what proportion of the student body that group is. However, since these are all small liberal arts schools, the scales are comparable.
As we approach 2019, both graphs show an overall increase in the trend of POC attaining both general degrees and STEM specific degrees. This trend is generally observed for all schools analyzed. This could be attributed to various causes: It’s possible that accessibility to degrees has increased overtime for the POC subpolution- whether that’s emotional accessibility with POC individuals feeling more confident in their ability or willingness to enter STEM fields, intellectual accessibility with their pre-college/high school classes preparing them to have the same skills as their non POC counterparts, or social accessibility with the cohort being diverse enough for them to feel comfortable and confident joining or even welcoming enough for them to want to take part in.
When we’re thinking more generally about archive and what’s available at what scale it’s important to note that this data was available from a national survey through the Department of Education, but this specific information about the intersection of ethnicity and degree/field of study was not provided by the institutions we respectively attend when we reached out to registrars’ offices. This leads us to question why we find anonymity important.
Perhaps it is for the protection of the individuals. But does that anonymity obscure the lived experiences of the people of color at these institutions? It is important to be cognizant of both telling stories of POC while not tokenizing their experiences or setting them apart from the student body through categorization.