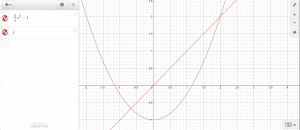
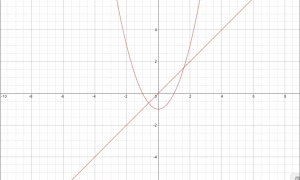
In analyzing the fixed points of discrete dynamical systems, one of our most useful resources is the Cobweb Diagram, which is a process of plotting the graph of the DDS’s function simultaneously with the line y = x, then drawing lines between the two curves as a visualization of the iterations of the DDS.
Videos:
Jeff’s Office Hours:
Gif of a Cobweb Plot near an attracting fixed point (CLICK)
Gif of a Cobweb Plot near a repelling fixed point (CLICK)

